In the first part of this series, I confessed my obsession with data and described how testing and tracking have helped me become a better athlete. Part I looked at cycling power and blood testing. In this post, I’ll share an assortment of other results and insights gleaned from testing and tracking my running, body composition, bone density and heart. While it’s not all good news, it’s certainly all useful information.
Running
While my 2014 season generally exceeded my expectations, if anything was disappointing, it was my running. I ran my fastest half marathon off the bike (1:15) at my first race of the season followed by a string of consistent but underwhelming 1:18-19 runs on a variety of courses. Although my cycling and swimming improved markedly, my running had at best reached a plateau.
This reflected a few factors including more balanced training, more aggressive bike pacing and adjusting to being heavier, which made my running feel ungainly for a long time. But no excuses. My coach and I agreed that I’ll have to run a fair bit quicker to vie for the podium on a consistent basis.
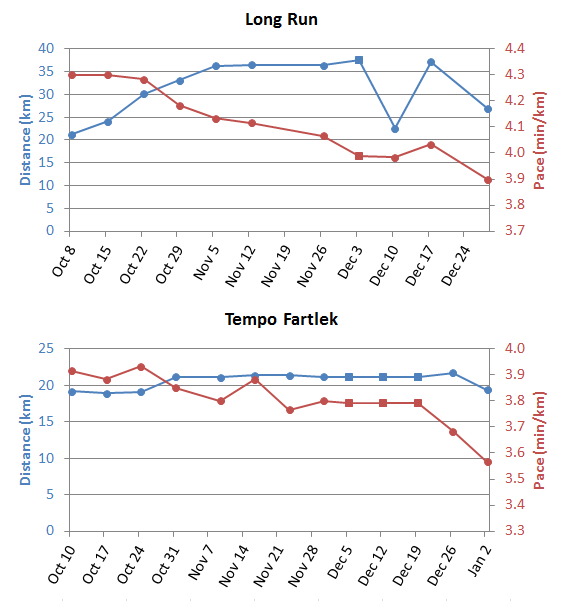
Last fall featured my best and most consistent run training ever. Peaking at 6.5 hours and ~100 km, it wasn’t my highest mileage ever, but certainly my highest quality running. Quite unlike previous years, I scarcely did any “easy” running slower than 4:20/km pace, and many 20+km sessions averaged well under 4:00/km. A typical week included the following sessions:
- long run building from 1.5 to 2.5 hours with a slight negative split, progressing to almost 38 km at ~2:50 marathon pace
- 1.25 hour tempo fartlek (1,2,2,3,4,5,5,4,3,2,2,1 mins at ~3:15-30/km with 1 min jog recovery)
- 1 hour VO2max session (~10 mins of intervals at ~3:00-3:10/km) on the track or treadmill
- 1-1.5 hour endurance run (~3:55-4:20/km) sometimes with 12 short hill sprints
- one or two easy 15 min jogs to/from the pool
The long run and tempo fartlek showed a solid progression in my fitness (figures below). These sessions were usually done on similar, flat to gently rolling routes at roughly the same perceived exertion from week to week. It’s useful to have a record of how I responded to this type of training when it comes to structuring my build into race season.
In January, I turned my attention away from running and cycling and headed to Texas for a month-long pro triathlete swim training camp hosted by Magnolia Masters. Training with no fewer than three Ironman Champions and a repeat US Open Water Swimming Champion has been humbling, but very productive. Look for a post on that experience next month.
Body composition
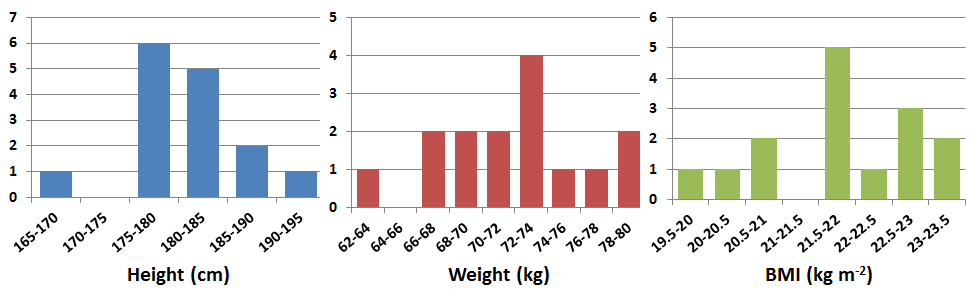
Triathlon is a somewhat unusual sport in that there is a good deal of heterogeneity in body weight and composition among successful athletes, even at the elite level. For example, the top 15 men at the 2014 Ironman World Championship ranged in height, weight and BMI from 168-193 cm, 63-79 kg and 19.9-23.1 (histograms below). This broad range contrasts starkly with the relatively homogeneous lead pack at any world class marathon and many other sports. There also appears to be a significant range in body fat percentage among successful pro triathletes (perhaps ~5-10% for men), although I haven’t seen a good dataset to illustrate this.
Given that world class triathletes are a relatively diverse group in this respect, optimizing body weight and composition to achieve peak performance can be a puzzle. This year, I began consulting a sports dietitian with extensive experience with elite endurance athletes. She recommended regular body composition testing to help inform what is essentially a trial and error process. The goal isn’t to target some predetermined “ideal” body weight and composition, but to collect data and identify trends and correlations with performance over time. This information can help guide the periodization of training, diet, and body weight and composition over the course of the season.
Here are the key results from my first body comp test in early November, five weeks into off-season training:
Height: 182 cm (5′ 11.5″)
Weight: 71.6 kg (158 lbs)
BMI: 21.6
Body fat (estimated): 8.6%
Like more than a few competitive endurance athletes, my relationship with eating and weight reflected a misguided and counterproductive “less is more” mentality until not long ago. I’ve touched on this in a few previous posts. I eventually gained 9-11 kg (20-25 lbs) between 2012 to 2014 and got faster practically every single month.
After a somewhat awkward adjustment period with my running, I’m achieving personal best training in all three sports at 71-72 kg. My weight peaked at ~74 kg in October following some post-season downtime, making this the first season ever that I will approach race weight from above.
Bone mineral density (BMD)
I was surprised when my sports doctor ordered a BMD test, since it’s not a standard test for healthy young men. I can only assume that the motherly technician performing the test was used to assisting frail elderly folks, because I honestly didn’t need any help taking off my jeans for the DXA scan.
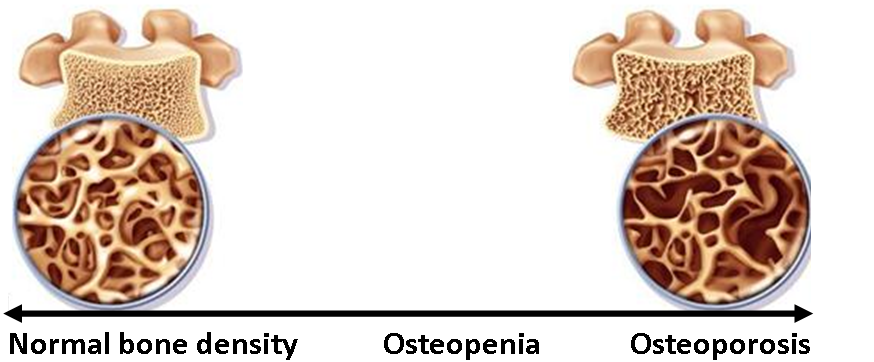
The test showed that I’m osteopenic, as my doctor suspected. Blank stare. What? Osteopenia refers to bone mineral density that is below normal, but not to the extent of osteoporosis. Osteopenia can be precursor of osteoporosis. Given that athletes in weight-bearing sports like running tend to have above normal bone density, my results didn’t look good.
I couldn’t help picturing crashing my bike and shattering into a million shards… but my doctor explained that I shouldn’t be overly concerned. Fortunately, I haven’t had a single acute or stress fracture.
I learned that low bone density is one of the many insidious effects of low testosterone [1,2]. Bone density responds very slowly and, in my case, is likely a legacy of years of low T. My doctor is optimistic that retesting next year will show improvement. In the meantime, don’t even think about crossing my wheel in a group ride!
Heart
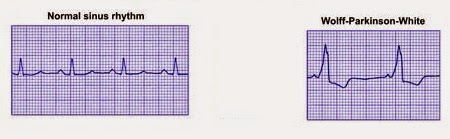
A couple weeks later, I was called back into my doctor’s office for another unpleasant surprise. My first ever ECG showed that I had a congenital heart defect known as Wolff-Parkinson-White syndrome. Another blank stare. What? I learned that my heart has an abnormal extra electrical pathway that produces a characteristic pattern on an ECG.
WPW syndrome can produce arrhythmias such as tachycardia (fast heart beat) or atrial fibrillation (afib). It’s believed to have a prevalence of 0.1-0.3% and carry a risk of sudden cardiac death of about 0.25% per year, or 3% to 4% over a lifetime [1,2,3,4]. WPW has been implicated in at least one recent triathlon drowning [5]. Fortunately, I’ve been completely asymptomatic as far as I’m aware, which should put me at lower risk. I have a follow up stress test booked next month. I’ll consider it a deep personal failure if I don’t set the lab’s record on the treadmill!
Hopefully you found something informative in this mishmash of personal info. There is an adage in business that is equally applicable in sports: “You can’t manage what you don’t measure”. I believe that testing and tracking are the first steps towards understanding and improving.
Please join the conversation about this post on Facebook, Twitter or in the comments below.